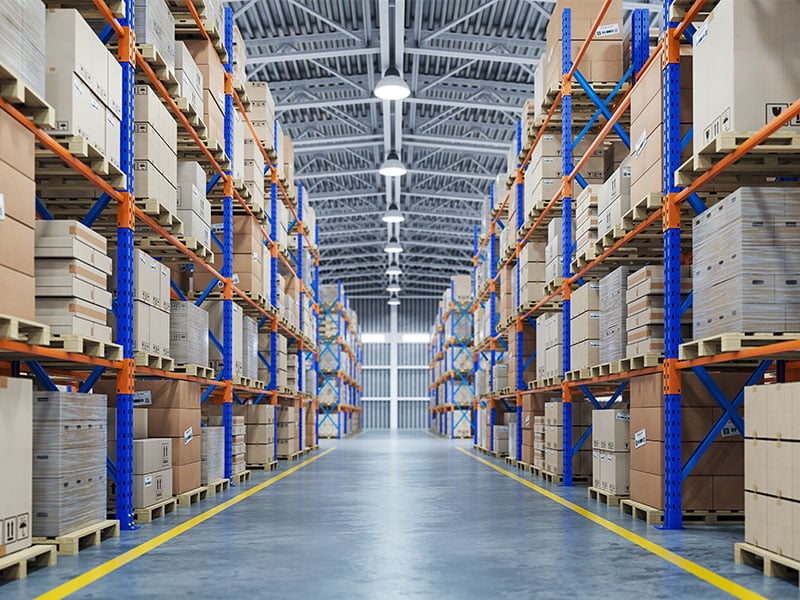
Warehouse Management & OperationsWe offers a host of logistic management services and supply chain solutions. consectetur adipiscing elit. Full...
Read More
AMCTS offers advanced inventory management solutions that aim to help clients achieve maximum inventory output while balancing supply and...
Read More
AMCTS offers a wide range of Material Handling Equipment (MHE) solutions to meet the needs of their clients. Some...
Read More
At AMCTS, we understand the importance of transportation in the Gulf economy, and our comprehensive transportation solutions are specifically...
Read More
Contracting & Trading Division ServicesAt AMCTS Contracting Company, our Contracting & Trading Division offers a comprehensive range of services...
Read More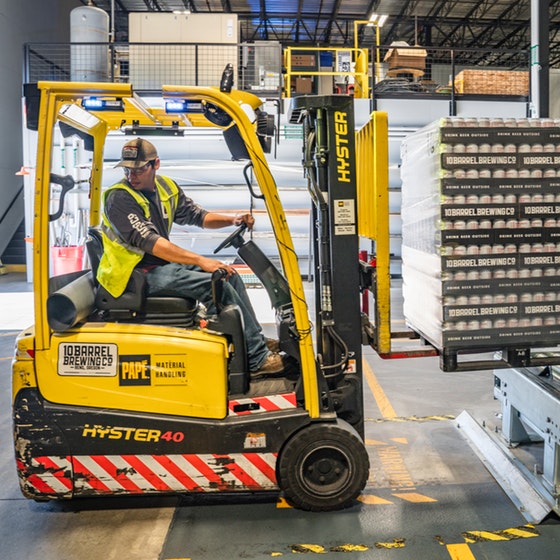
Materials Procurement, Storage, and Supply ServicesAt our company, we understand that reliable materials procurement, storage, and supply services are...
Read MoreWe, AMCTS provides companies comprehensive world-class supply chain and logistics services within the kingdom of Saudi Arabia. AMCTS works with companies that are seeking to achieve increased productivity through an effective and efficient supply chain.
The company offering logistic management services and supply chain solutions provides a variety of services related to logistics and supply chain management. The company's services include transportation, warehousing, and distribution, which are aimed at optimizing each task and ensuring goods are transported timely and efficiently.
We are proud to announce that our operations extend across the Middle East, specifically in Saudi Arabia, United Arab Emirates (UAE), and Qatar.
Our support team is available around the clock, seven days a week, to address any questions, concerns, or issues that our customers may have. Whether you need technical support for a product, assistance with an order, or simply have a question about our services, our team is here to help.